CoreDNS篇3-接入prometheus监控
本文最后更新于:June 24, 2021 pm
本文主要对coredns的prometheus监控进行介绍,以及对grafana中配置coredns的dashboard进行分享。
0、背景
Prometheus插件作为coredns的Plugins,默认情况下是内置在coredns中,如果是自己编译安装的版本,需要注意在编译安装的时候的plugin.cfg文件中添加了prometheus:metrics,这样才能确保编译成功。
1 | |
1、简介
prometheus 插件主要用于暴露CoreDNS相关的监控数据,除了coredns本身外,其他支持prometheus的插件(如cache插件)在启用的时候也可以通过prometheus插件暴露出相关的监控信息,默认情况下暴露出的监控数据在localhost:9153,路径为/metrics,**配置文件中的每个server块只能使用一次prometheus。**下面是一些coredns自身相关的指标:
coredns_build_info{version, revision, goversion}- 关于 CoreDNS 本身的信息coredns_panics_total{}- panics的总数coredns_dns_requests_total{server, zone, proto, family, type}- 总查询次数coredns_dns_request_duration_seconds{server, zone, type}- 处理每个查询的耗时coredns_dns_request_size_bytes{server, zone, proto}- 请求的大小(以bytes为单位)coredns_dns_do_requests_total{server, zone}- 设置了 DO 位的查询(queries that have the DO bit set)coredns_dns_response_size_bytes{server, zone, proto}- 响应的大小(以bytes为单位)coredns_dns_responses_total{server, zone, rcode}- 每个zone的响应码和数量coredns_plugin_enabled{server, zone, name}- 每个zone上面的各个插件是否被启用
需要注意的是上面频繁出现的几个标签(label),这里额外做一些解释:
zone:每个request/response相关的指标都会有一个zone的标签,也就是上述的大多数监控指标都是可以细化到每一个zone的。这对于需要具体统计相关数据和监控排查问题的时候是非常有用的server:是用来标志正在处理这个对应请求的服务器,一般的格式为<scheme>://[<bind>]:<port>,默认情况下应该是dns://:53,如果使用了bind插件指定监听的IP,那么就可能是dns://127.0.0.53:53这个样子proto:指代的就是传输的协议,一般就是udp或tcpfamily:指代的是传输的IP协议代数,(1 = IP (IP version 4), 2 = IP6 (IP version 6))type:指代的是DNS查询的类型,这里被分为常见的如(A, AAAA, MX, SOA, CNAME, PTR, TXT, NS, SRV, DS, DNSKEY, RRSIG, NSEC, NSEC3, IXFR, AXFR and ANY) 和其他类型 “other”
If monitoring is enabled, queries that do not enter the plugin chain are exported under the fake name “dropped” (without a closing dot - this is never a valid domain name).
2、配置
coredns中想要启用prometheus插件,只需要在对应的zone中加上这一行配置即可,默认监听的是本机127.0.0.1的9153端口,当然也可以根据自己的需要更改监听的网卡和端口。
Syntax
prometheus [ADDRESS]
我们直接来看一段配置:
1 | |
prometheus的生效范围是按照zone来划分的,在上面的这个配置中:
tinychen.com:53这个域使用的是Prometheus的默认配置,那么此时的监听情况就是默认的127.0.0.1的9153端口,请求http://127.0.0.1:9153/metrics/这个地址就能够获取到tinychen.com:53这个域的监控信息- 同理在
http://192.168.100.100:9253/metrics/这个地址能够获取到google.com:53这个域的监控信息 example.org这个域因为没有添加prometheus指令,所以在任何地址都不会暴露相关的监控信息
如果有多个zone,每个zone都有相同的基础配置,也可以使用import指令,如:
1 | |
可以简化成这样:
1 | |
3、grafana配置dashboard
coredns原生支持的prometheus指标数量和丰富程度在众多DNS系统中可以说是首屈一指的,此外在grafana的官网上也有着众多现成的dashboard可用,并且由于绝大多数指标都是通用的,多个不同的dashboard之间的panel可以随意复制拖拽组合成新的dashboard并且不用担心兼容性问题。我们可以很容易的根据自己的实际需求配置对应的权威/递归/组合DNS相关的监控项。
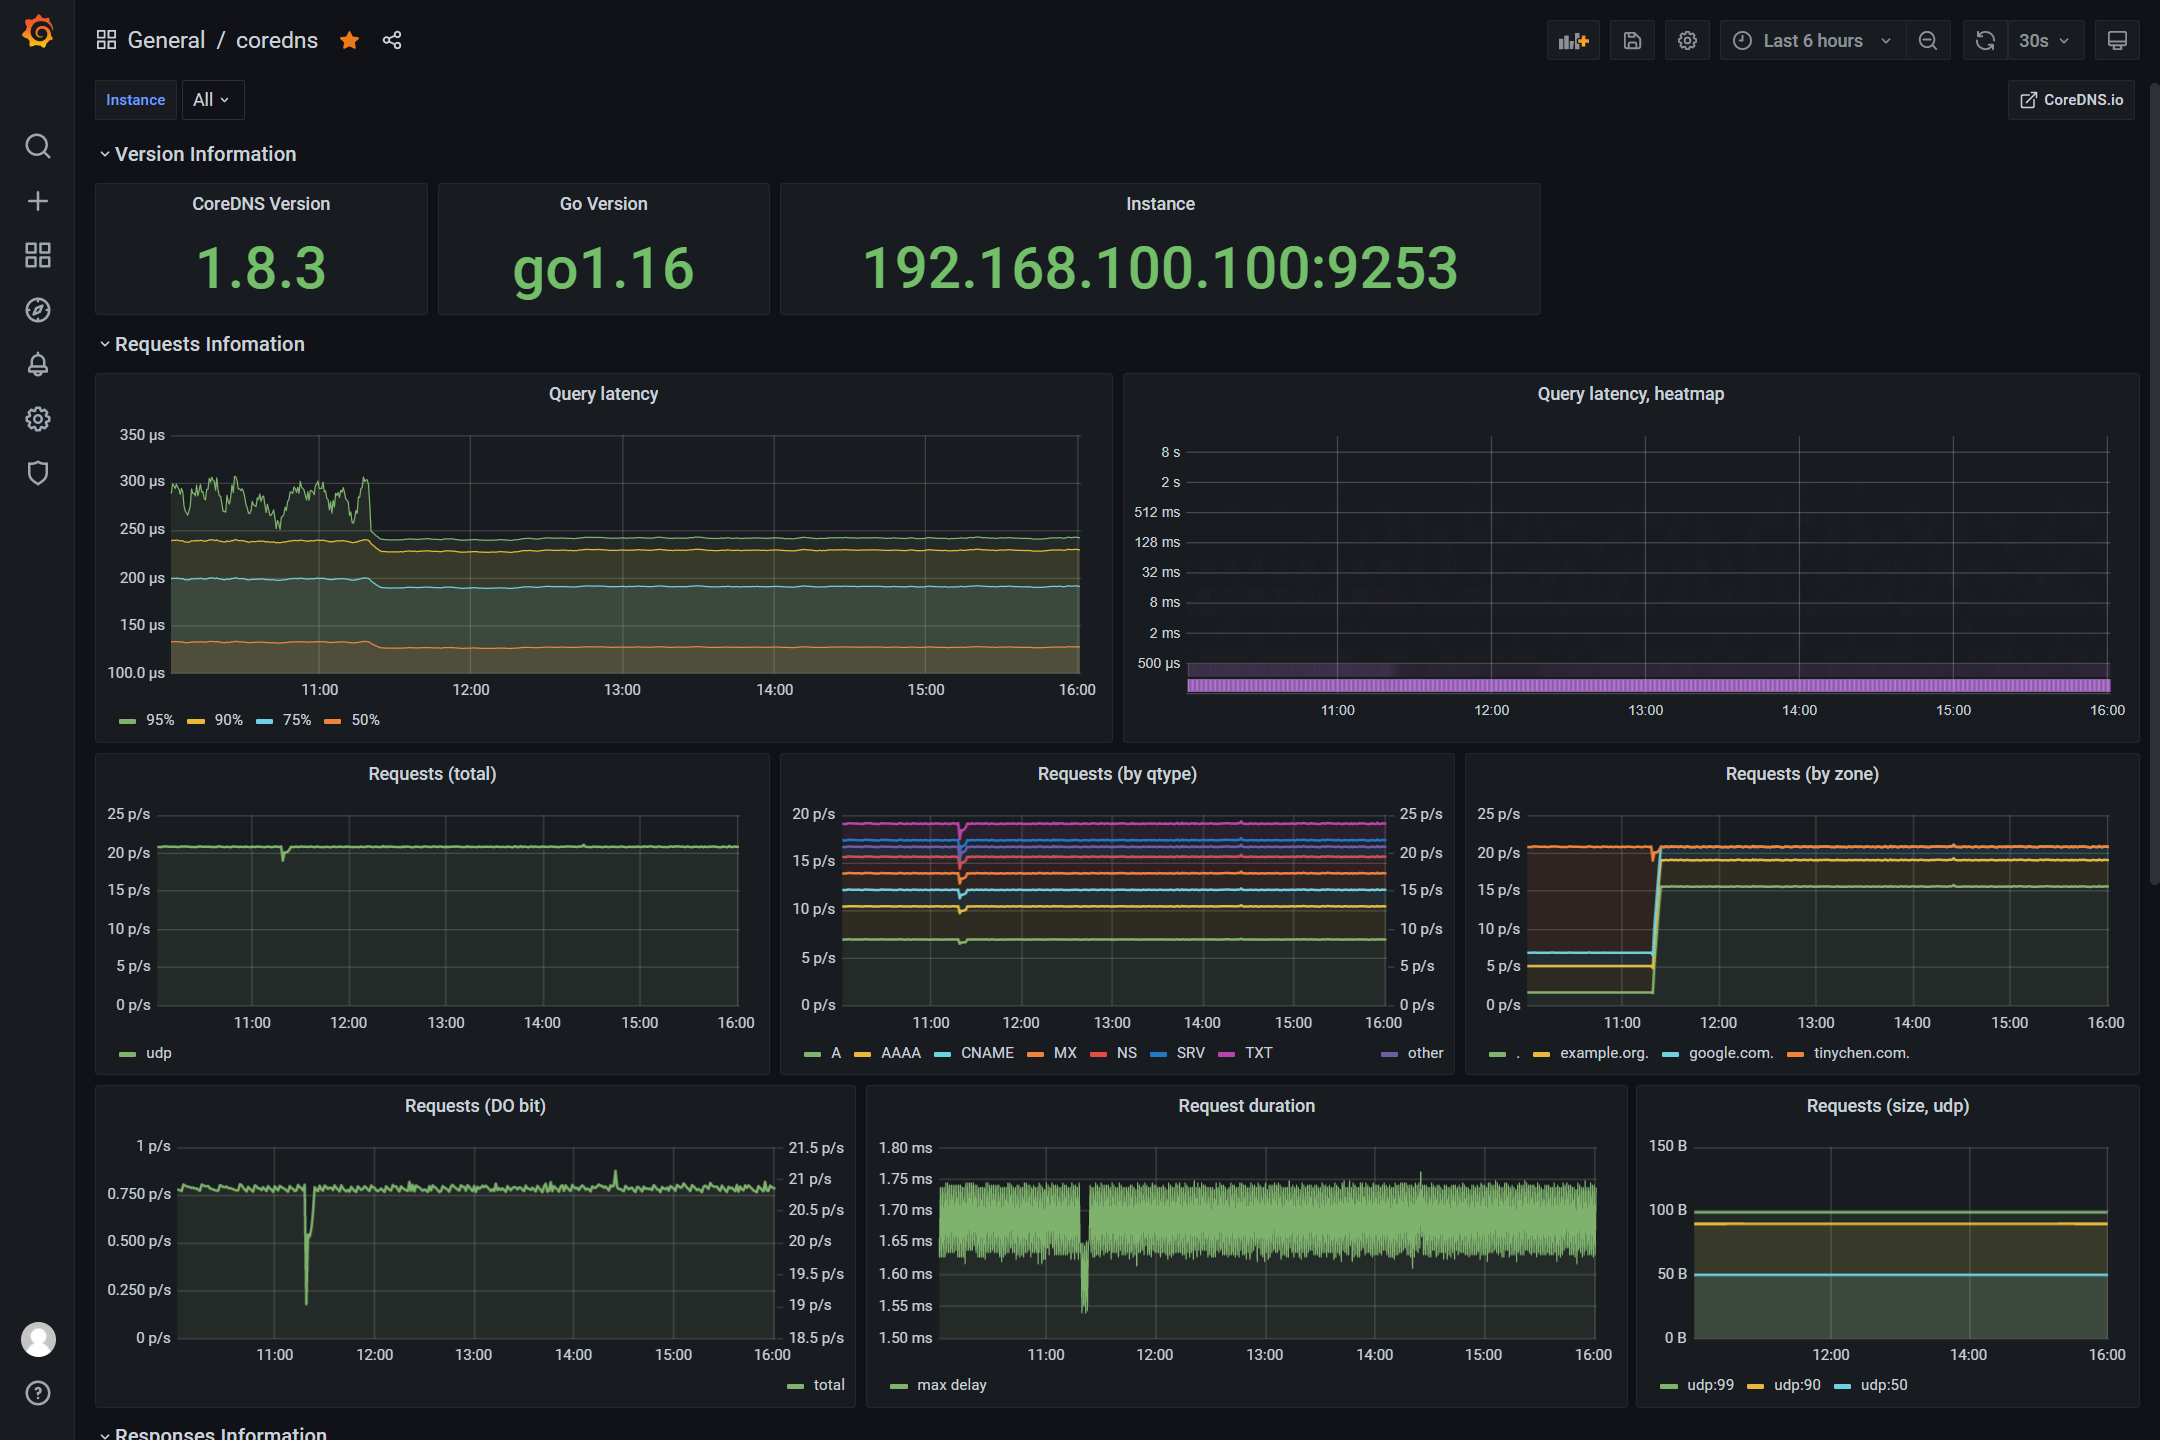
如上图我们可以看到能够监控出不同DNS类型的请求数量以及不同的zone各自的请求数量,还有其他的类似请求延迟、请求总数等等各项参数都能完善地监控起来。
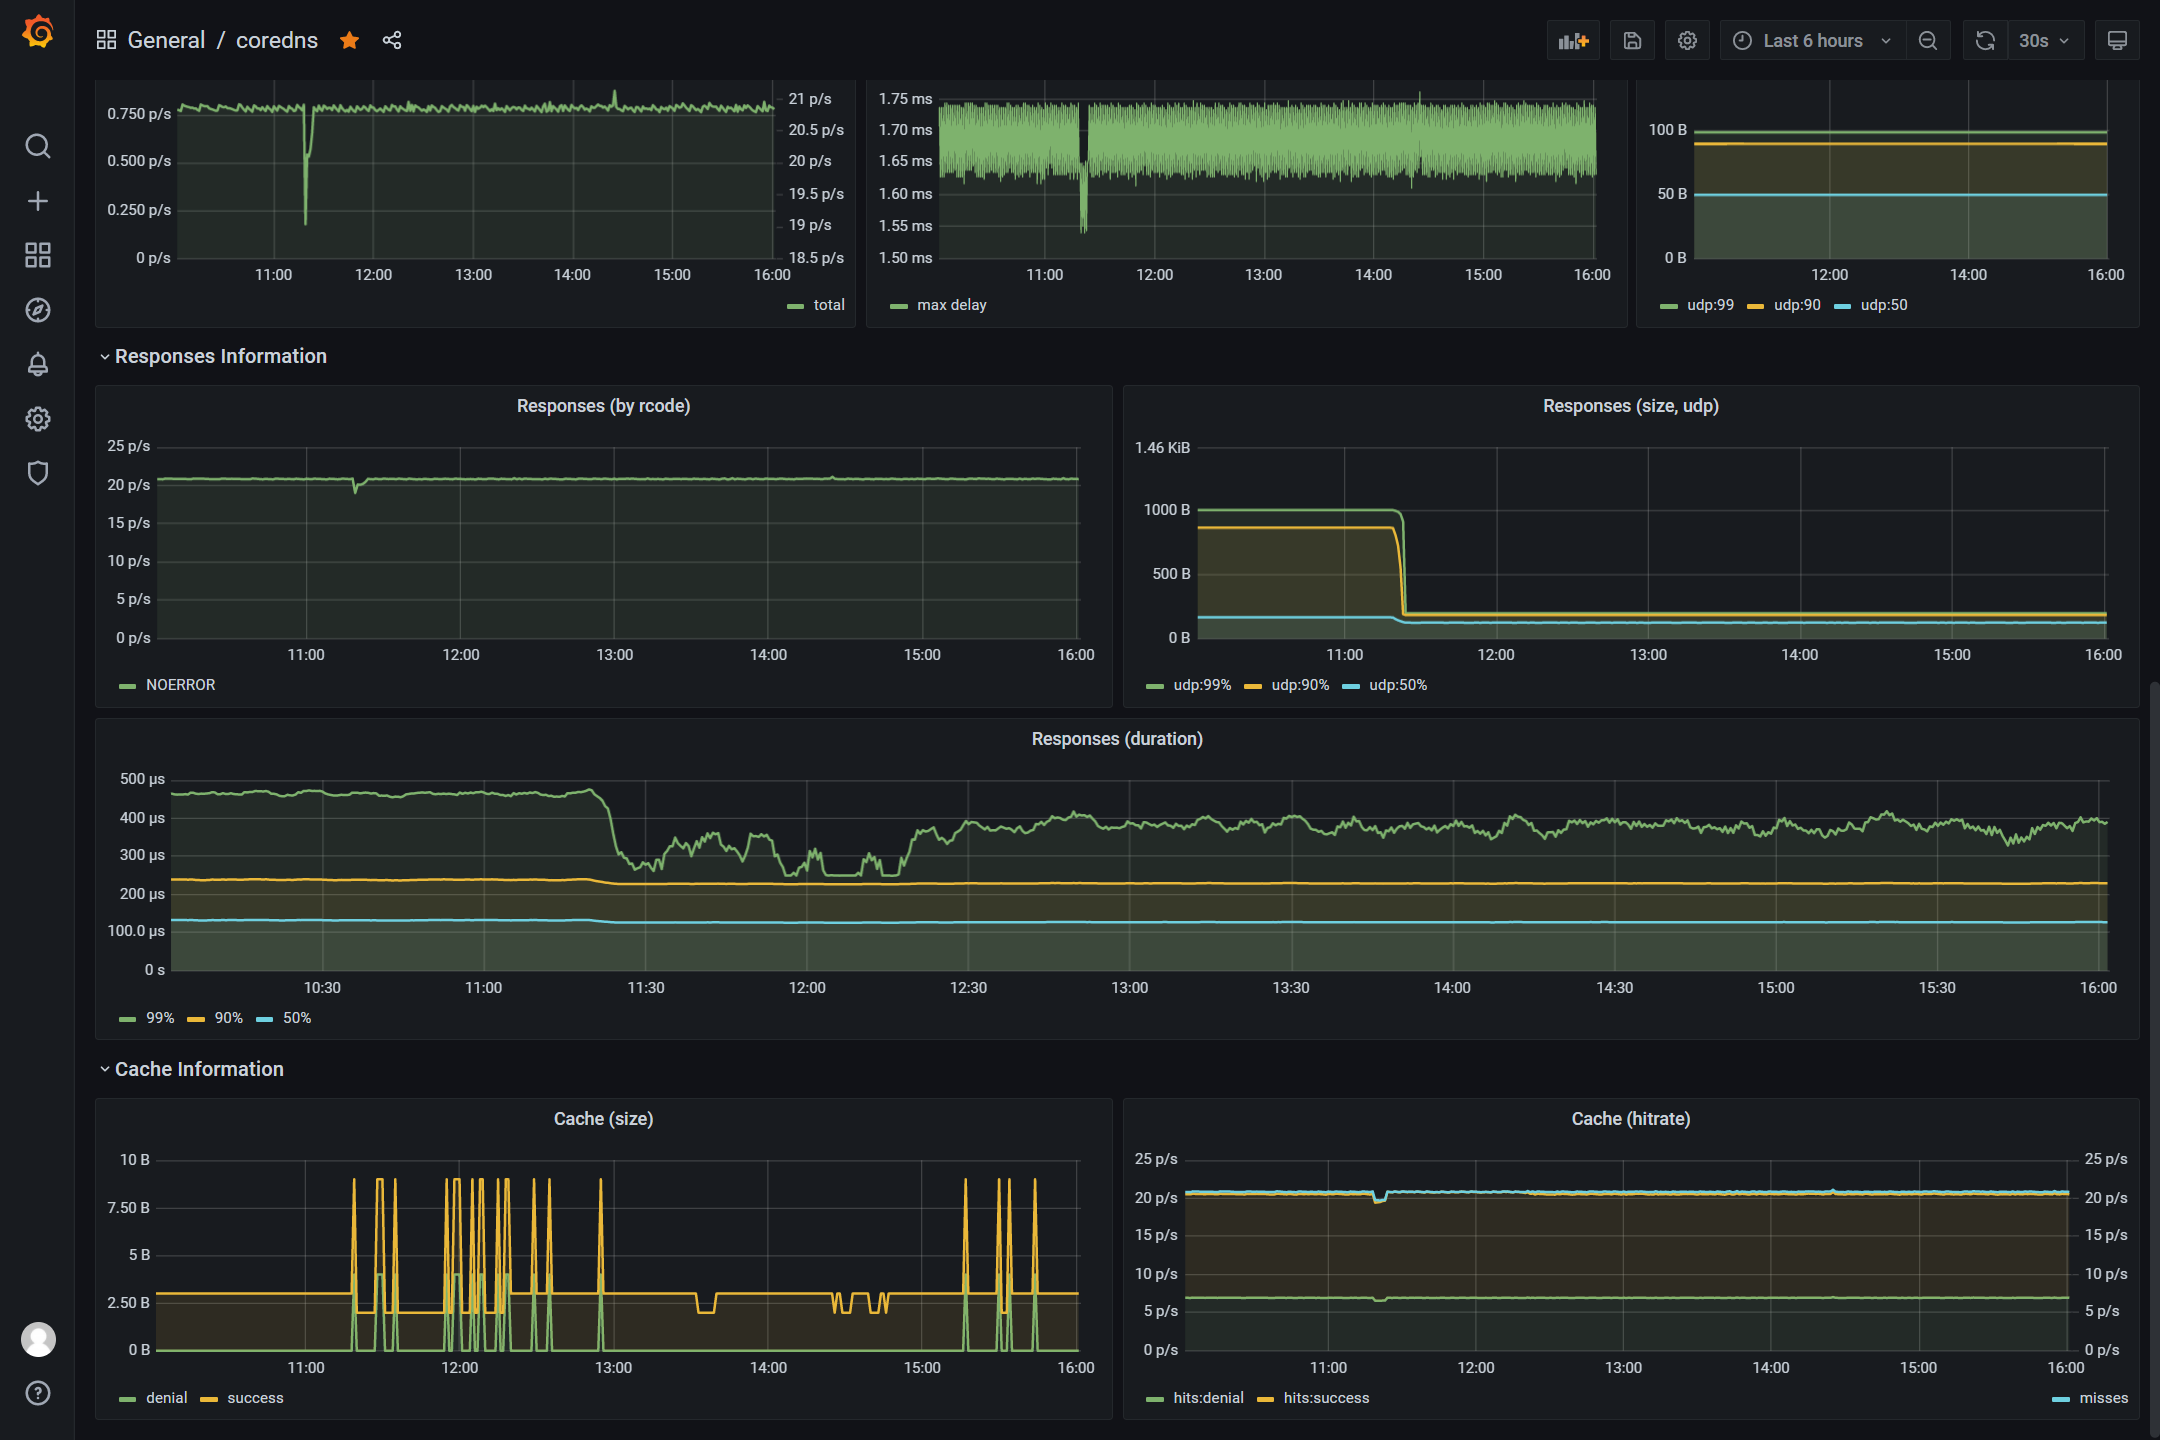
如上图我们能看到可以监控到不同的请求的传输层协议状态,缓存的大小状态和命中情况等各种信息。